The Line Graph Shows the Past and Projected Finances for A Local Authority in New Zealand. Summarize the Information by Selecting and Reporting the Main Features and Make Comparisons Where Relevant.
 Sample Answer: The Line Graph Shows the Past and Projected Finances for A Local Authority
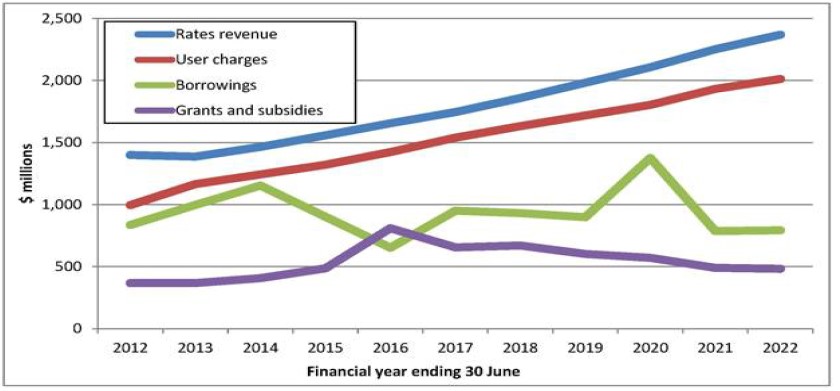
The teacher shows that fast and projects finances for a local authority in New Zealand. The data has been calibrated in a million dollars, depicted by the rendered line graph.
To begin with, rates revenue and user charges are almost the same in that hold time in 2012 revenues started with about 1500 million dollars and rapidly increased since 2022. On the other hand, user charges are also going very well. It started with 1060 million in 2012 and has risen since 2022 to nearly 2000 million dollars.
In addition, grants and subsidies need to be in better condition moreover. It started with almost 500 million in 2012 to 2025. After that, it increased in 2016 and went down dramatically in 2017. After that, it was coming down slowly in a continued way. However, it comes again at 500 million dollars in 2022.
Follow Us On IELTSData Facebook Page For More Updates
In this financial year, it landed on 30 June, on the other hand, because Borrowings were not stable the whole time. It started at around 800 million. Moreover, it ended up at nearly 750 million dollars after a zigzag up-and-down fluctuation pattern.