ACADEMIC WRITING

The Line Graph Shows Visits to And from The Uk from 1979 to 1999, and The Bar Graph Shows the Most Popular Countries Visited by Uk

The Line Graph Shows Visits to And from The Uk from 1979 to 1999

The line graph shows visits to and from the UK from 1979 to 1999, and the bar graph shows the most popular countries visited by UK residents in 1999. The line graph illustrates the number of visitors coming and leaving the United Kingdom (UK) between 1979 and 1999. The bar graph portrays the most popular […]

The Line Graph Shows Visits to And from The Uk from 1979 to 1999 Read More »
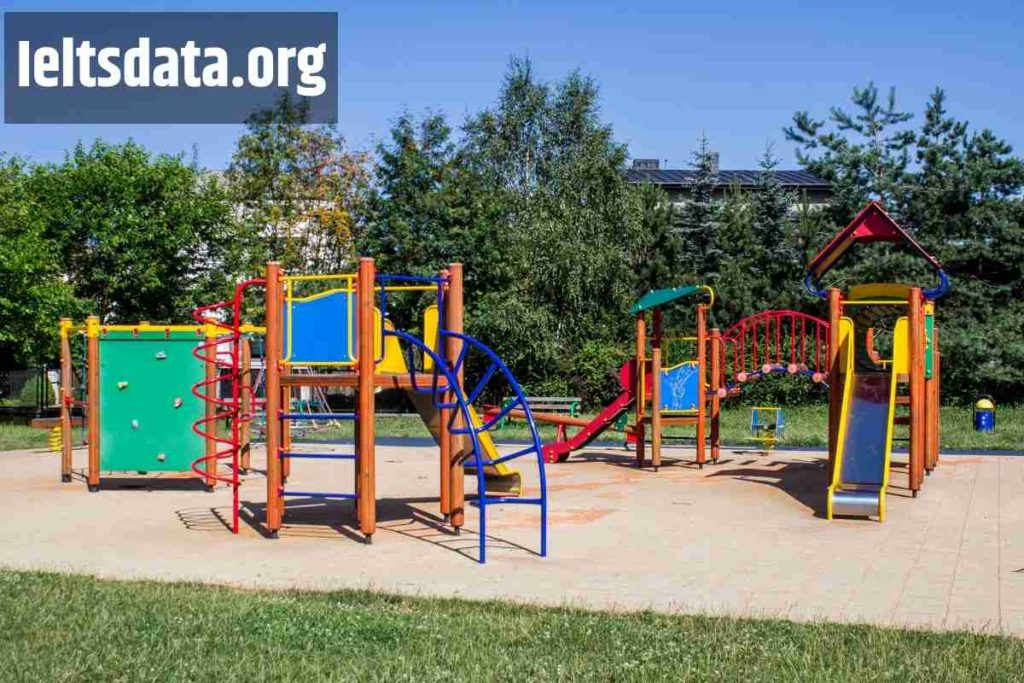
The Local Council Is About to Destroy the Children’s Playground in Your Area Because It Is Underused

The Local Council Is About to Destroy the Children’s Playground in Your Area Because It Is Underused

The local council is about to destroy the children’s playground in your area because it is underused. write a letter and tell them: Why it is not well used What can be done so more people can use it. Respected Sir, I am writing this letter to discuss the decision to demolish the children’s playground

The Local Council Is About to Destroy the Children’s Playground in Your Area Because It Is Underused Read More »

The Table and Charts Below Give Information on The Police Budget for 2017 and 2018 in One Area of Britain.

The Table and Charts Below Give Information on The Police Budget for 2017 and 2018 in One Area of Britain.

The table and charts below give information on the police budget for 2017 and 2018 in one area of Britain. The table shows where the money came from, and the charts show how it was distributed. Summarise the information by selecting and reporting the main features and making relevant comparisons. The given table represents the

The Table and Charts Below Give Information on The Police Budget for 2017 and 2018 in One Area of Britain. Read More »

The Maps Below Show an Industrial Area in The Town of Norbiton and Planned Future Development of The Site (3) (1)

The Maps Below Show an Industrial Area in The Town of Norbiton and Planned Future Development of The Site

The maps below show an industrial area in the town of Norbiton and planned future development of the site. Summarise the information by selecting and reporting the main features, and make relevant comparisons. The given map shows how the industrial area of Norbiton industrial. Overall, we can say that there will be an amount of

The Maps Below Show an Industrial Area in The Town of Norbiton and Planned Future Development of The Site Read More »

The Table Below Shows the Sales at A Small Restaurant in A Downtown Business District AC Writing (1)

The Table Below Shows the Sales at A Small Restaurant in A Downtown Business District: AC Writing

The table below shows the sales at a small restaurant in a downtown business district. Summarise the information by selecting and reporting the main features, and making comparisons where relevant. The tabular chart illustrates information about the hotel’s cells in the district’s commercial area 7 days a week. The data has been calibrated in dollars.

The Table Below Shows the Sales at A Small Restaurant in A Downtown Business District: AC Writing Read More »

The pie chart gave information on UAE government spending in 2000. The total budget was AED 315 billion

The Pie Chart Gave Information on UAE Government Spending in 2000. The total budget was AED 315 billion

The pie chart gave information on UAE government spending in 2000. The total budget was AED 315 billion. Summarise the information by selecting and reporting the main features, and make comparisons where relevant. The pie chart illustrates the expenditure of the UAE government in 2000 for different sectors. Overall, the maximum budget was spent on

The Pie Chart Gave Information on UAE Government Spending in 2000. The total budget was AED 315 billion Read More »