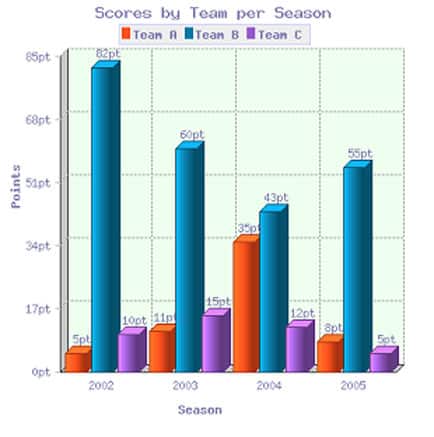
The Bar Chart Shows the Scores of Teams a, B, and C Over Four Different Seasons.
Summarize the information by selecting and reporting the main features and make comparisons where relevant.
You should spend about 20 minutes on this task.
Sample Answers of the AC Writing The Bar Chart Shows the Scores of Teams a, B, and C Over Four Different Seasons.
The given bar graph illustrates the information about the results of team A, B and C in the four years.
Overall, Team B was scored maximum from the A and C, but team C has scored too much minimum, which was less than A also.
In the year 2020, the scores which were taken by team A that was 5 points whereas, team B has scores too high points it was near about 80 while, and team C has taken 10 points. Moreover, In 2003, team A and C was scored near about 15 points, but team B has scored a total of 60 points.
Furthermore, team A has scored 35 points, and Team B was scored more than 10 points from team A, and team C has scored 12 points in the year 2004 as well as, in the year 2005, team A and C was scored similar which was near about 8 points, but team B was scored above 50 points.