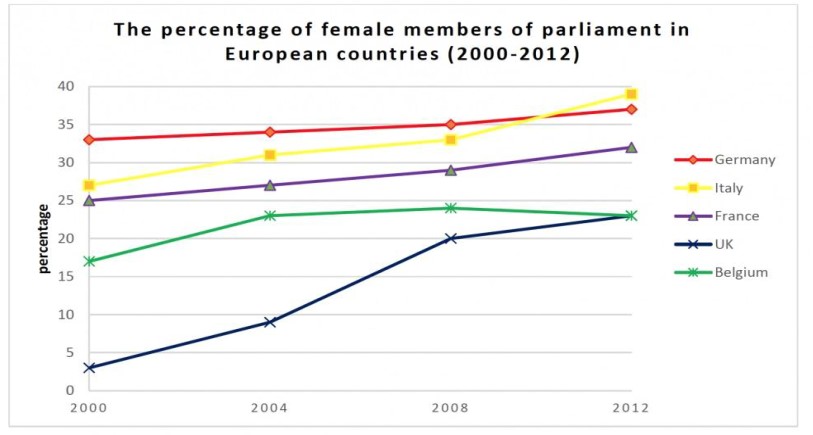
The Chart Below Shows the Percentage of Female Members of Parliament in 5 European Countries from 2000 to 2012. Summarize the Information by Selecting and Reporting the Main Features, and Make Comparisons Where Relevant.
 Sample Answer: The Chart Below Shows the Percentage of Female Members of Parliament
The line graph depicts information about the proportion of women who were members of parliament in five different European Nations between 2000 and 2012.
Overall, Germany had the highest proportion of women in the initial year. However, compared to last year, the highest percentile was in Italy—the lowest number of women members of parliament in the United Kingdom.
It is crystal clear from the chart that in 2000, the percentage of women members of parliament in Germany was around 34%, which gradually increased and reached approximately 36% in 2012. The percentage of Italian women members was between 25 and 30 in 2000 while it increased over time and stood at just over 39% at the end of the year. In the starting year, France’s women members of parliament percentile was 25%, which was increased by approximately 6% in 2012.
Follow Us On IELTSData Facebook Page For More Updates
The Belgian women percentage was around 70% in 2000, increased by approximately 7% in 2004 and remained the same in the next year. However, in 2012, Belgium’s percentage of women declined by around 2%. There were only a just 4% of women members of parliament in the United Kingdom in 2000. it increased and reached there 20% in 2008. In 2012, the person tile of women in parliaments was the same as in the Belgium percentile.