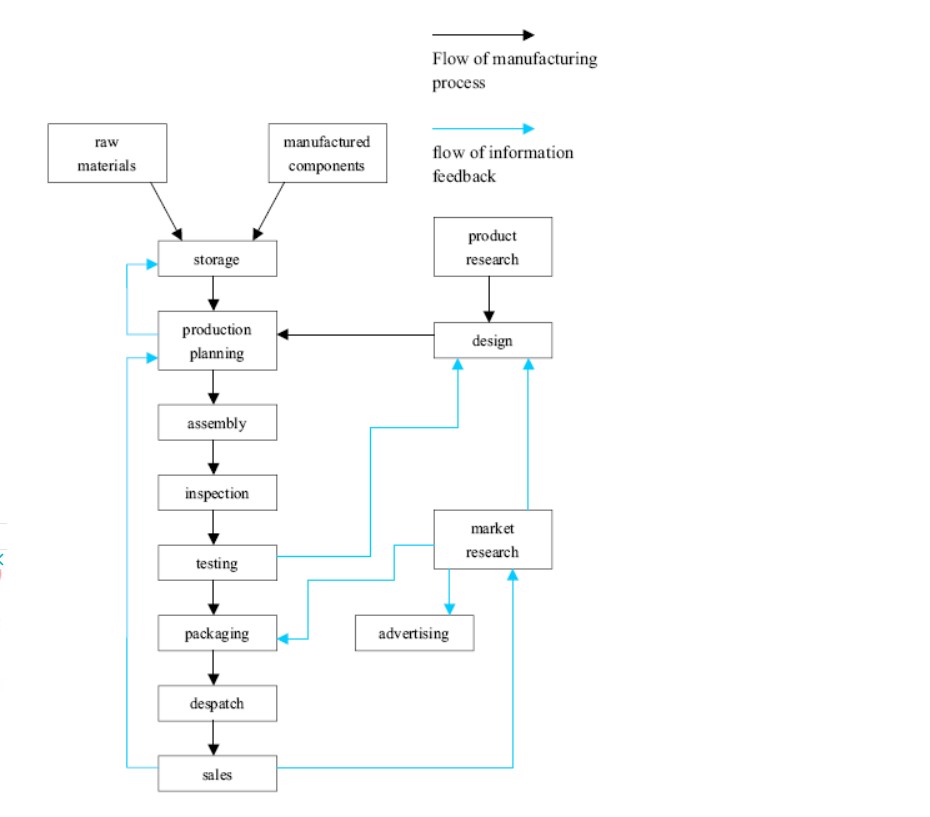
The diagram below shows the typical stages of consumer goods manufacturing, including how information is fed back to earlier stages to enable adjustment. Write a report for a university lecturer describing the process shown.
The given flowchart depicts the information of variant processing stages of consumer variables and how the data is channelled back to the modification source.
Overall, it can be seen that the manufacturing phases are carried out in an orderly manner, from collecting the components and ending with the sales of the goods.
The product manufacturing process is initiated by assembling raw materials and manufacturing components that are kept in storage until the production planning stage is planned. The production planning stage consists of design and research. The entire process is carried out through assembly, inspecting and testing the components, packaging, further lead to the dispatch of product into the markets for sale to the consumers.
Market research and product research contributes relevant feedbacks to the advertisement, packaging and design, respectively. From the sales, valuable opinions will run upward to the market research, production planning and design. Additionally, production planning provides feedback for storage.
Follow Us on IELTSDATA Twitter
Also Read The Bar Chart Shows the Scores of Teams a, B, and C Over Four Different Seasons.

Pingback: The Graphs Below Show the Numbers of Male and Female Workers in 1975 and 1995: AC Writing Task 1 - IELTS DATA