The Graph Below Shows Fish Consumption and Different Kinds of Meat in A European Nation Between 1979 and 2004. Summarise the Information by Selecting and Reporting the Main Features, and Make Comparisons Where Relevant.
Sample 1: The Graph Below Shows Fish Consumption and Different Kinds of Meat in A European Nation
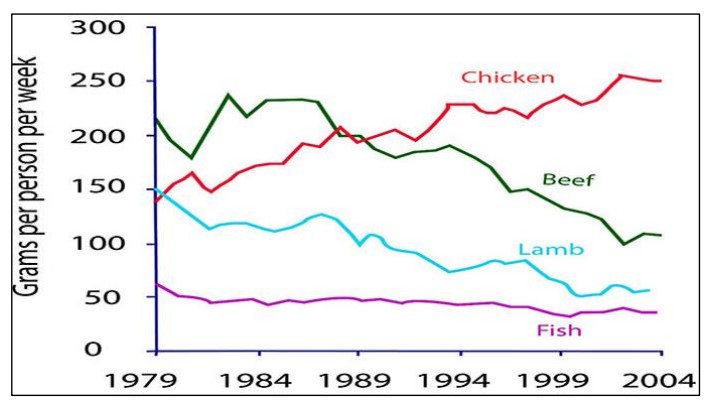
This given line graph illustrates the statistics about how the European country took several types of meat such as fish, lamb, beef and chicken. The units are measured in digits; the years under consideration were from 1974 to 2004. After analysis, it can be seen that the maximum number of pupils ingested chicken. While the consumption of fish was the least.
In an in-depth analysis, it can be seen that in 1979, Chicken consumption was approximately 150 grams, then increased steadily and reached its peak of about 250 grams in 2004.
In contrast, the partaking of beef and lamb looked the same proportion. They started at 200 and 150 respectively, but beef consumption diminished continuously, while the consumption of beef also declined by almost 100 grams per person per week, after that, it started to rise again in 2004.
But, fish remained unpopular throughout the period with a little decline of 10 grams from just over 60 grams per person intake.
In summary, people started consuming more chicken than beef and lamb. Fish consumption remained almost the same over the bestowed period.
Sample 2: The Graph Below Shows Fish Consumption and Different Kinds of Meat in A European Nation
The line chart illustrates the non-veg food consumed by people. Such as fish, chicken, beef, and lamb, in European countries in the past 25 years.
Overall, it is seen people in the former year most loved that beef. However, at the year’s end, beef’s popularity declined. On the other hand, chicken. Which was second in position in terms of eating, was most loved by people at the end of the year.
In 1979, the natives of European countries gave preference to eat beef more than any other non-vegetarian items. However, the popularity of beef fell off in the next two years. That is around 185 grams per week, and the same trend followed in the remaining years. Around 50 grams per person per week consuming the fish. Which was the least, and after facing some fluctuations, it remained for the whole year.
The data further collates that chicken and lamb were eaten almost in the same quantity in 1979. However, the folks started declining to eat lamb, and it fell off and ate nearly the same in quantity as fish, which is around 5 per person per week. On the other hand, chicken consumption increased drastically, and, in the end, it was the most loved food by the citizens of European countries.