The Graph Below Shows the Quantities of Goods Transported in The UK between 1974 and 2002 By Four Different Modes of Transport. Summarise the information by selecting and reporting the main features and make comparisons where relevant.
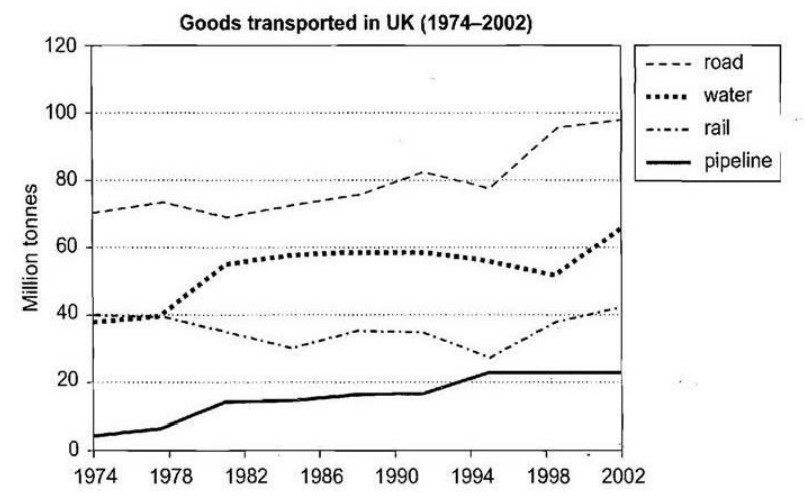
Overall, it can be seen that road and water carried more goods in the UK than the amount carried by rail and pipelines.
Firstly, in 1974, the road became the leading mode of transport among other transports. The road carried about 70 tonnes of goods than the others, while water and rail also took 40 million tonnes of quantity of goods. The pipeline was the least, with about 5 million tonnes that same year.
Over the years, the road saw fluctuations and peaked at about 99 million tonnes in 2002. As for water, there was a gradual increase from 1978 to 1998 when it fell drastically to 50 million tonnes in 2002 and then rose sharply to 65 million tonnes.
Also, rail experienced some fluctuations and increased gradually to 40 million tonnes. The pipeline rose gradually to 30 million tonnes and decreased to 20 million in 2002.