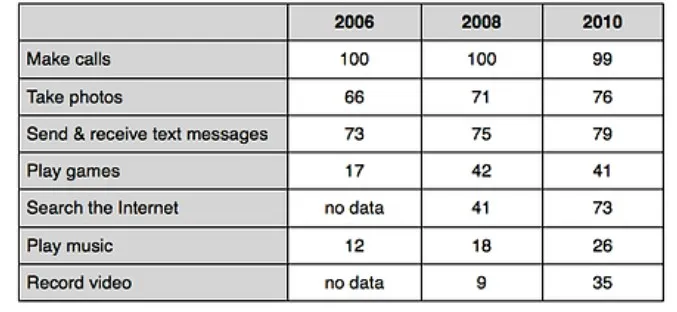
The Percentage of People Using Various Mobile Phone Features. Summarise the Information by Selecting and Reporting the Main Features, and Make Comparisons Where Relevant.
The information about the proportion of people using different smartphone applications is depicted in your table. The data is calibrated in percentage.
To outline the striking factor, it can be clearly seen that all features increased in given periods expect making calls and playing games, while making calls remained the same in 2006 and 2008, and there is no data available for searching on the internet and for recording video in 2006.
To begin with, in 2006, making calls tops the list with 100%, whereas sending and receiving messages was the second highest in the list with 73%; however, there is no information for internet usage and recording video. The less proportion was for playing music (12%) while for taking photos and playing games it was 66% and 70% respectively.
Moreover, in 2008, the figures for calling remained identical, but in 2010 they decreased by 1%. At the same time, the usage of messages Rose by 79% in 2010. Recording video outraced the proportion of playing music in 2010 with a difference of 9%. Furthermore, the preparation of searching on the internet and taking photos was just above 70%, which is why the percentage of playing games fell by one per cent in 2010 as compared to 2008.
Follow Us on IELTSDATA Twitter
