The pie charts below show how dangerous waste products are dealt with in three countries. Summarise the information by selecting and reporting the main features and make comparisons where relevant.
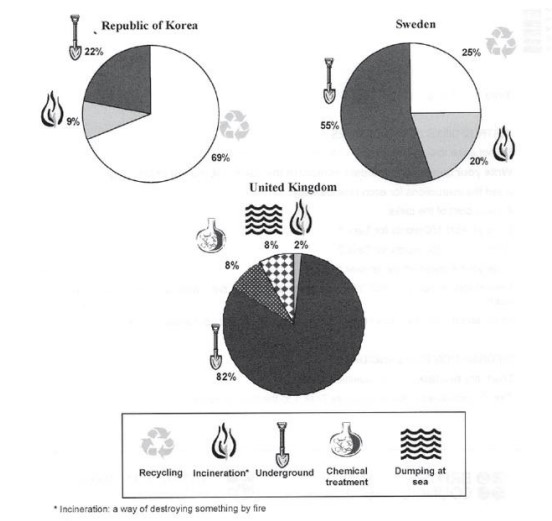
The charts compare Korea, Sweden and the UK regarding the methods used in each country to dispose of harmful waste.
It is clear that in both the UK and Sweden, the majority of dangerous waste products are buried underground. By contrast, most hazardous materials in the Republic of Korea are recycled.
Looking at the information in more detail, we can see that 82% of the UK’s dangerous waste is put into landfill sites. This disposal technique is used for 55% of the harmful waste in Sweden and only 22% of similar waste in Korea. The latter country recycles 69% of hazardous materials, which is far more than the other two nations.
While 25% of Sweden’s dangerous waste is recycled, the UK does not recycle at all. Instead, it dumps waste at sea or treats it chemically. These two methods are not employed in Korea or Sweden, which favour incineration for 9% and 20% of dangerous waste, respectively.
Also, Read The Diagram Below Gives Information About the Number of Parcels Delivered