The table below gives information about a restaurant’s average sales in three different branches in 2016.
Summarise the information by selecting and reporting the main features, and make comparisons where relevant.
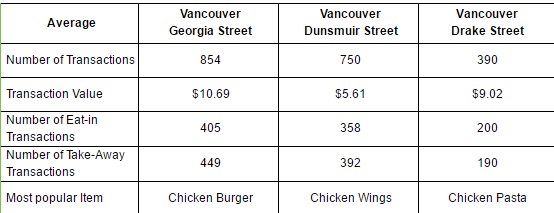
The table illustrates data about a restaurant’s average business in Vancouver city different streets in the year 2016. The streets ate Georgia, Dunsmuir, and Drake. The branches most popular items are Chicken Burger (Georgia), Chicken Wings (Dunsmuir), and Chicken Pasta (Drake). The overview based on information best sales in branch Georgia Street.
The number of transactions is very high at Georgia street (854) compare to Dunsmuir (750) and Drake (390) streets. The next factor is transaction value very less in Dunsmuir shop ($5.61) and highest value again at Georgia Street ($10.69) as follows Drake Street is $9.02. The table data portrays the Georgia shop is the best sales rather than two branches.
The next factors are the number of eat-in and take away transactions from shops. Georgia Street is 405 and 449 respectively, which is lofty compare to Dunsmuir (358 and 392) and the lowest amount in Drake Street is eat-in 200, and take away is 190. The transactions highest proportion scored Georgia Street expect transaction value factor which is a second position only.
sample answer 2
this is end of academic writing task 1(The table below gives information about a restaurant’s average sales in three different branches in 2016. Summarise the information by selecting and reporting the main features, and make comparisons where relevant.)
