The Graphs Below Provide Information on Global Population Figures

The graphs below provide information on global population figures and figures for urban populations in different world regions. Summarise the information by selecting and reporting the main features, and make comparisons where relevant. The given line graph represents the world population growth from 1800 to 2100 with some predictions. In contrast, in the bar graph, […]

The Graphs Below Provide Information on Global Population Figures Read More »
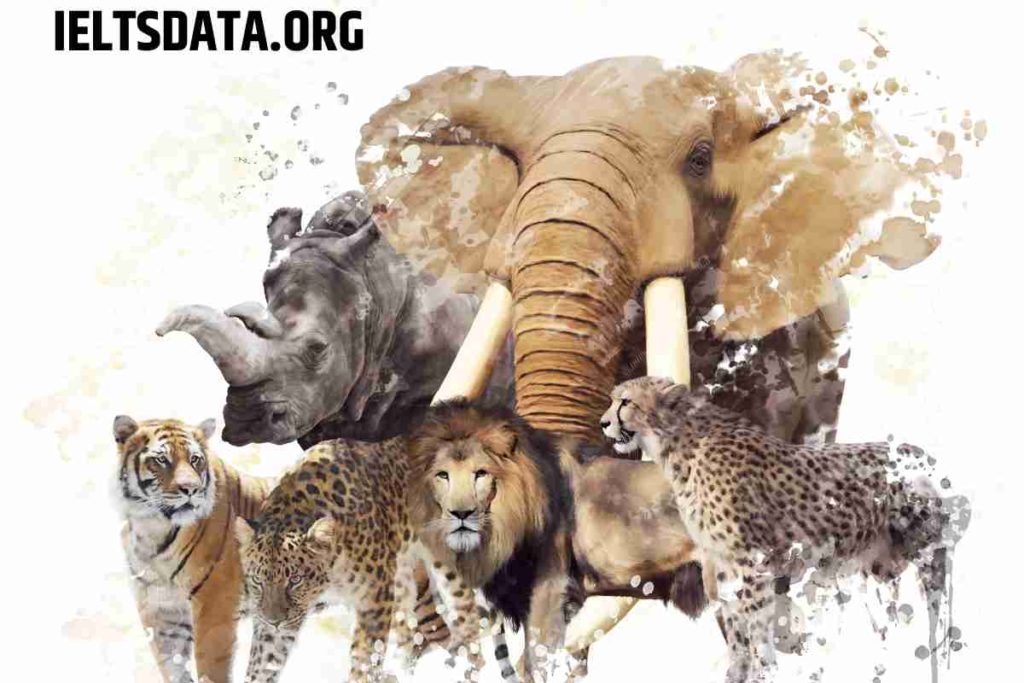
Wild Animals Have No Place in The 21st Century, so Protecting Them Is a Waste of Resources

Wild Animals Have No Place in The 21st Century, so Protecting Them Is a Waste of Resources

Wild animals have no place in the 21st century, so protecting them is a waste of resources. To what extent do you agree or disagree? The rate at which wildlife existence is being endangered is highly unprecedented in present times. As a result, there is a contentious argument over whether protecting wildlife is an absolute

Wild Animals Have No Place in The 21st Century, so Protecting Them Is a Waste of Resources Read More »

These Days More Fathers Stay at Home and Take Care of Their Children While Mothers Go out To Work (1)

These Days More Fathers Stay at Home and Take Care of Their Children While Mothers Go out To Work

These days more fathers stay at home and take care of their children while mothers go out to work. What could be the reasons for this? Do you think it is a positive or negative development? There is no arguing the fact that in present times, the role of parents is the most prominent key

These Days More Fathers Stay at Home and Take Care of Their Children While Mothers Go out To Work Read More »

The Charts Show the Distribution of Money Spent on Music in Three Different Years in Northern Ireland.

The Charts Show the Distribution of Money Spent on Music in Three Different Years in Northern Ireland.

The charts show the distribution of money spent on music in three different years in Northern Ireland. The pie chart illustrates how the money issued on music was spent in three different years in Northern Ireland. Overall it can be seen that a lot of money was spent on purchasing CDs in all three years while

The Charts Show the Distribution of Money Spent on Music in Three Different Years in Northern Ireland. Read More »