The given Table Shows the Percentage of Household Consumer Durables Sold. in the UK from 1972 to 1983. It can be divided into three groups.
Sample Answer of The Given Table Shows the Percentage of Household Consumer Durables Sold
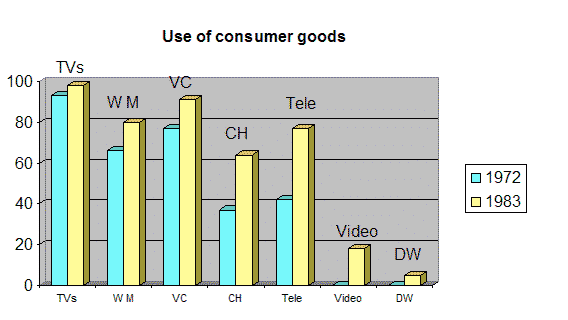
The vertical bar graph reveals the information about the proportion of different goods used by plebeians namely television, washing machine, vacuum cleaner, Central heating, telephone, videos and, lastly, dishwasher in the United Kingdom in the year 1972 and 1983.
Overall the most striking feature is that fluctuations had been observed in the usage of various kinds of electronic equipment.
It is evident from the bar graph that people gave more preference to watch television in the year 1972 and the rate was gradually rose to almost 92% in the following 11 years. The use of the washing machine ranked the second position from all the durables which were slightly above 60% and one – eighth part in the year 1972 and 1983 respectively.
Moreover, the same trend was followed by the use of vacuum cleaner, if compared with the latter one with a minimal rose in both the years. Almost one – third families used central heating it increased steadily to 63% in the last year as same as in the case of television, the utilized was fourfold and 77% in the initial year and in the last year orderly. People did not show interest in the to buy videos and dishwashers at the beginning of the Year so, the rate was almost negligible, but in the following years 18% of folk used videos and 5% dishwashers.