The chart below the global sales of different kinds of digital games from 2000 to 2006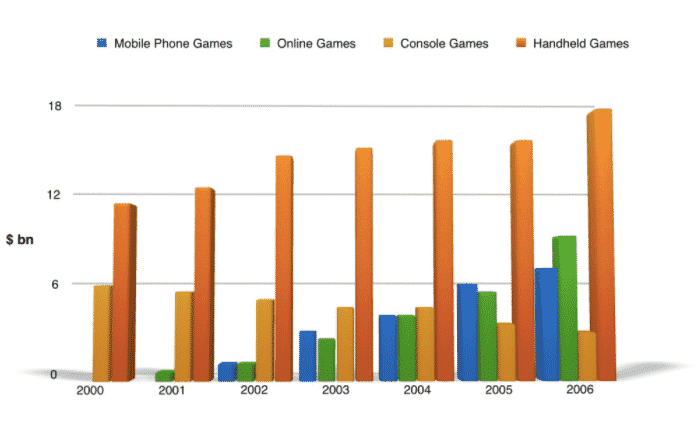
sample answer 1:
The rendered vertical bar graph expounds the information regarding the universal sale of distinct kinds of electronic units, namely, cell phone games, online games, console games and, lastly, handheld games, across six years from 2000 to 2006.
Overall, the most outstanding feature is that handheld games had had the first position in universal sales throughout the given tenure. As is presented in the bar graph, initial year, console games and handheld game’s sales were eminent among the whole globe, 6 billion dollar and 10 billion dollars respectively.
In the subsequent years, sales of console games fell around ($3bn), sales of handheld games were reached at the zenith point ($18bn), however, at the end of the year. Interestingly, the sale of mobile phone games and online games were zero in 2000. Online games started earning in 2001, whereas mobile games initiated their sale in 2002.
Before 2006, the sale of mobile phone games was more than the online games; after that, the latter surpassed the former,
Follow Us on IELTSDATA Twitter
this is the end of academic writing task 1(The chart below the global sales of different kinds of digital games )